Britain's data centre queue
Published June 2026 · Sourced from Ofgem, NESO, IEA · Read the full research → · 60-second TL;DR →
50 GW — three times Britain's entire peak demand
Applications to connect data centres to the British grid. The number that shows the scale of speculative excess.
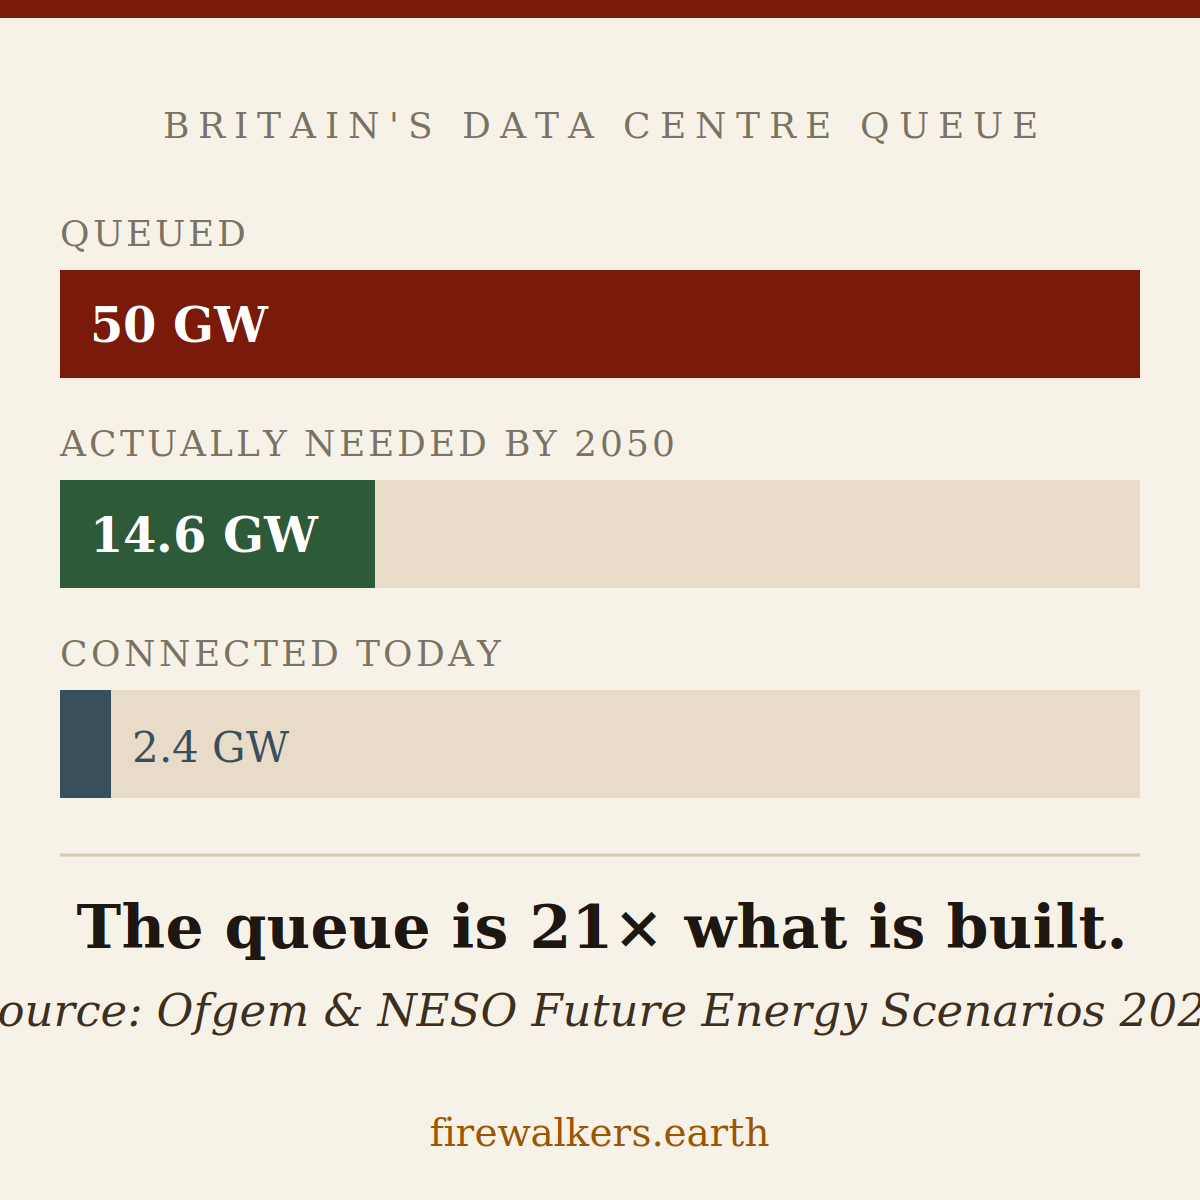
The queue is 21× what is actually built
A proportional bar chart showing queued vs needed vs connected. The most shareable data graphic from this research.
12 weeks — and most communities never know the clock is running
The consultation window every resident facing a data centre application needs to know about.
"Communities deserve better than a 12-week window"
Scott Seivwright on why communities facing data centre planning applications deserve proper time, information, and a real say in decisions that last decades.
The hidden water cost of AI
Published June 2026 · Sourced from Environment Agency, Meta, Google, Uisce Éireann · Read the full research → · 60-second TL;DR →
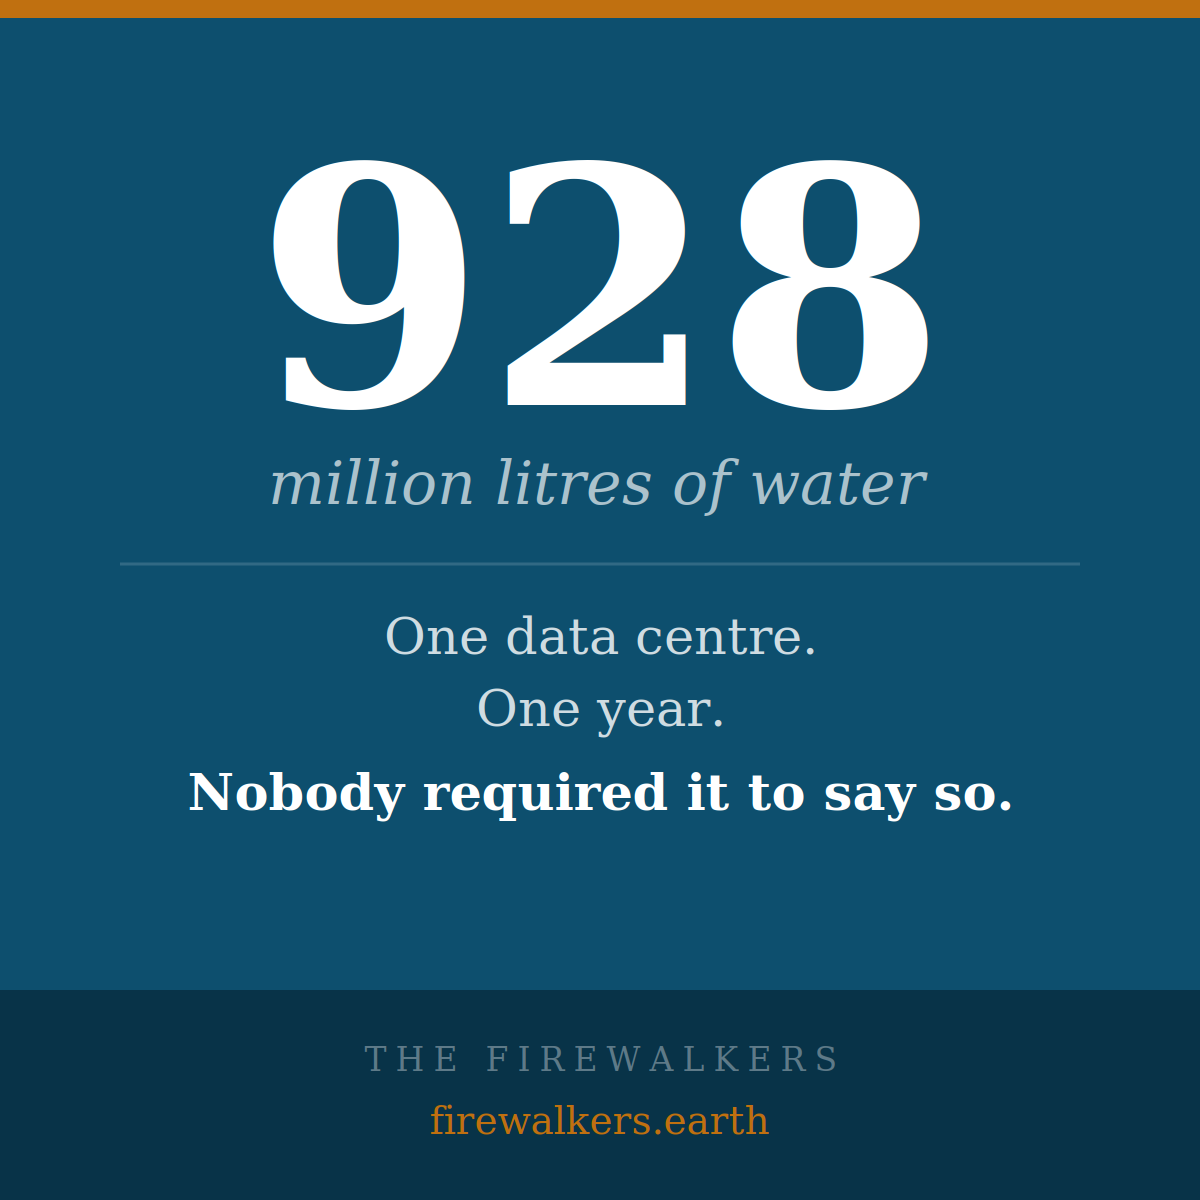
928 million litres — one data centre, one year
Meta's Clonee campus in Ireland. The number that puts the scale of data centre water use in plain sight.
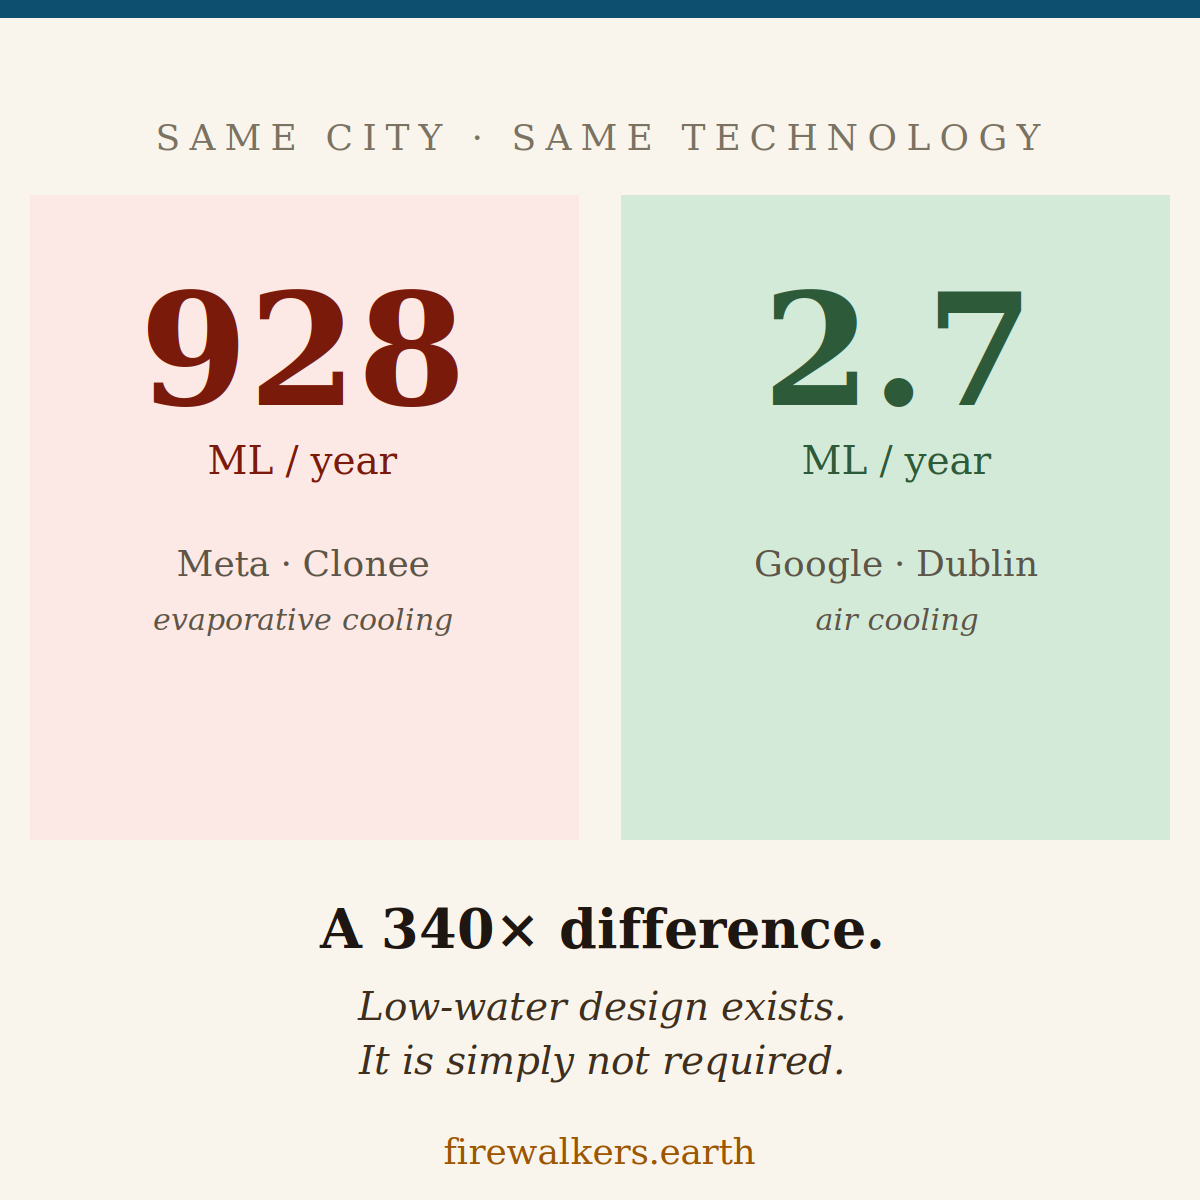
928 ML vs 2.7 ML — the 340× difference
Two data centres in the same city. The difference is entirely the cooling system. Low-water design exists. It is not required.
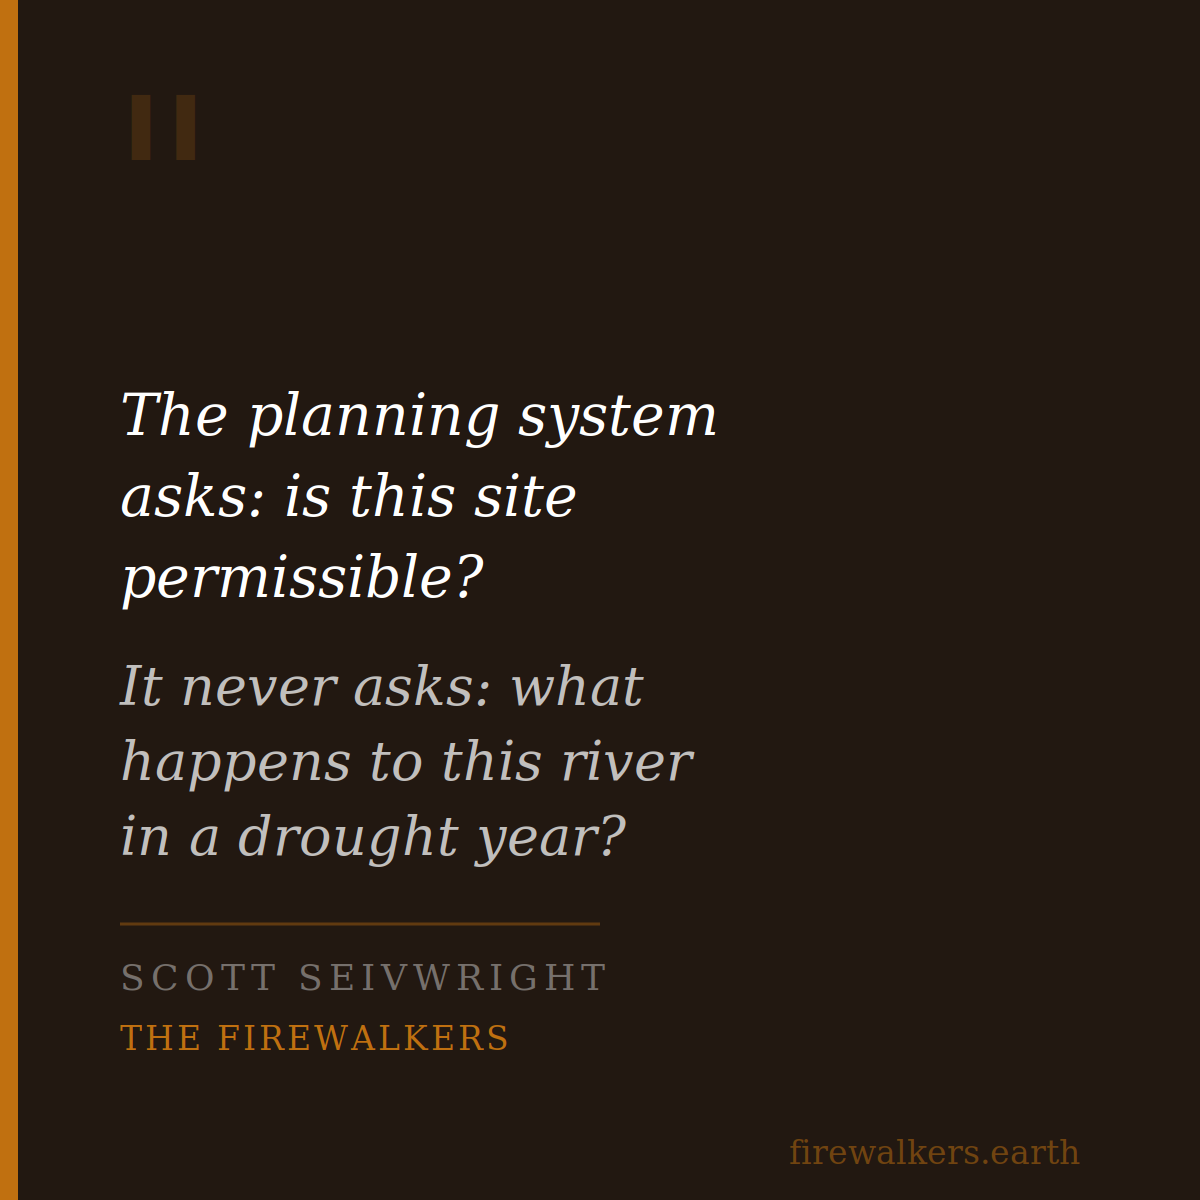
"The planning system never asks what happens to this river in a drought year"
Scott Seivwright on the fundamental gap in how planning authorities assess data centre water impact.
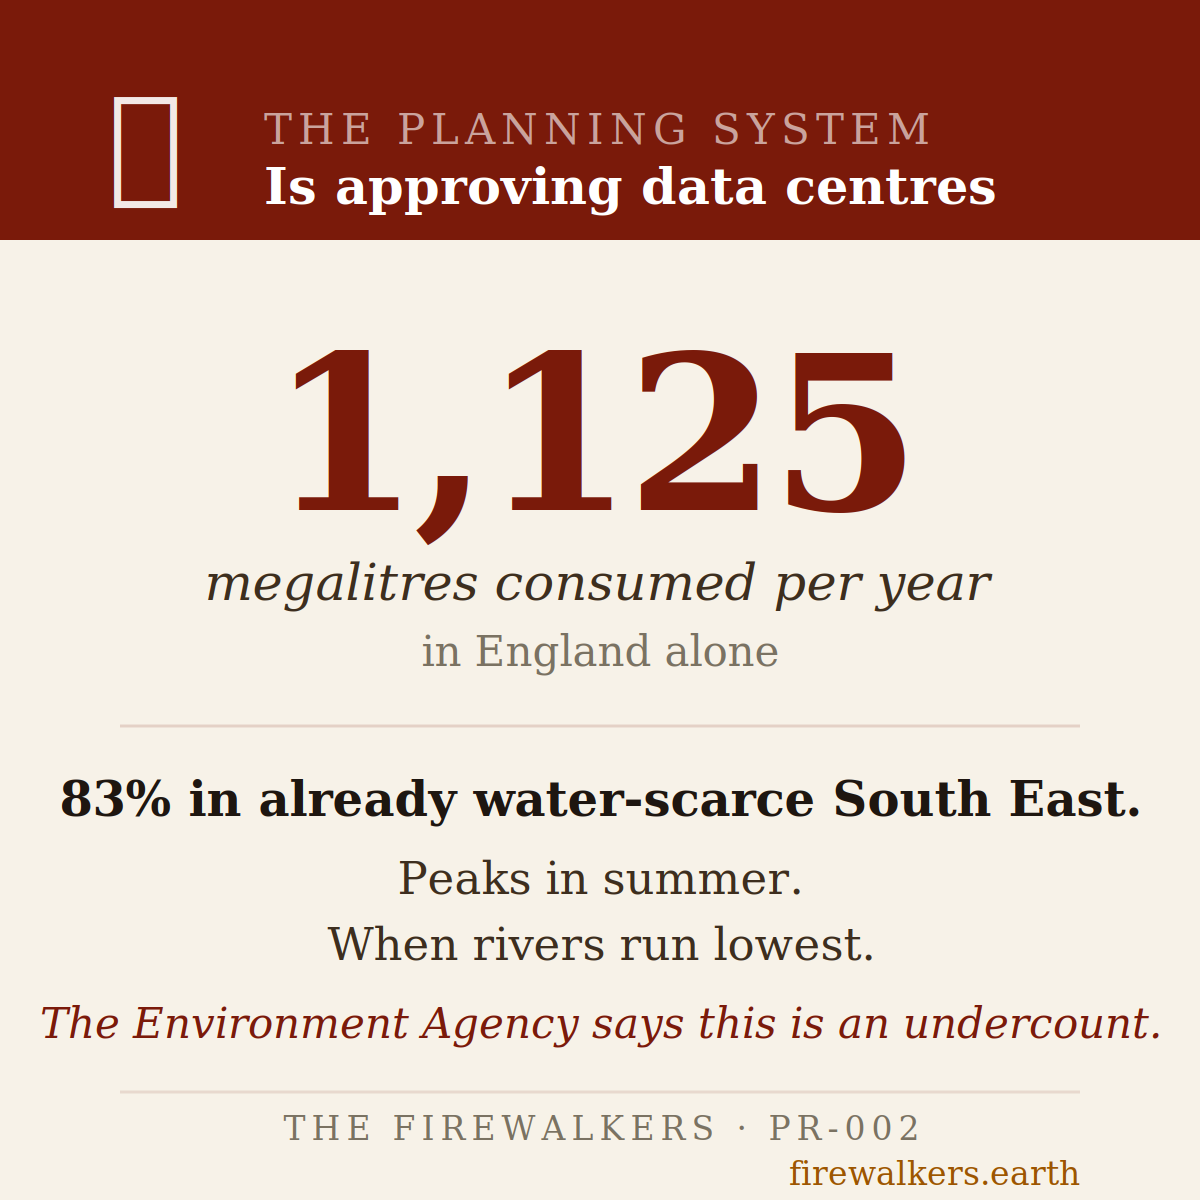
1,125 ML per year — and the Environment Agency says it's an undercount
England's data centre water consumption, 83% in the already water-scarce South East, peaking in summer when rivers run lowest.
The cost lands on the kitchen table
Published June 2026 · Sourced from Ofgem, Ofwat, ONS, JLARC Virginia · Read the full research → · 60-second TL;DR →
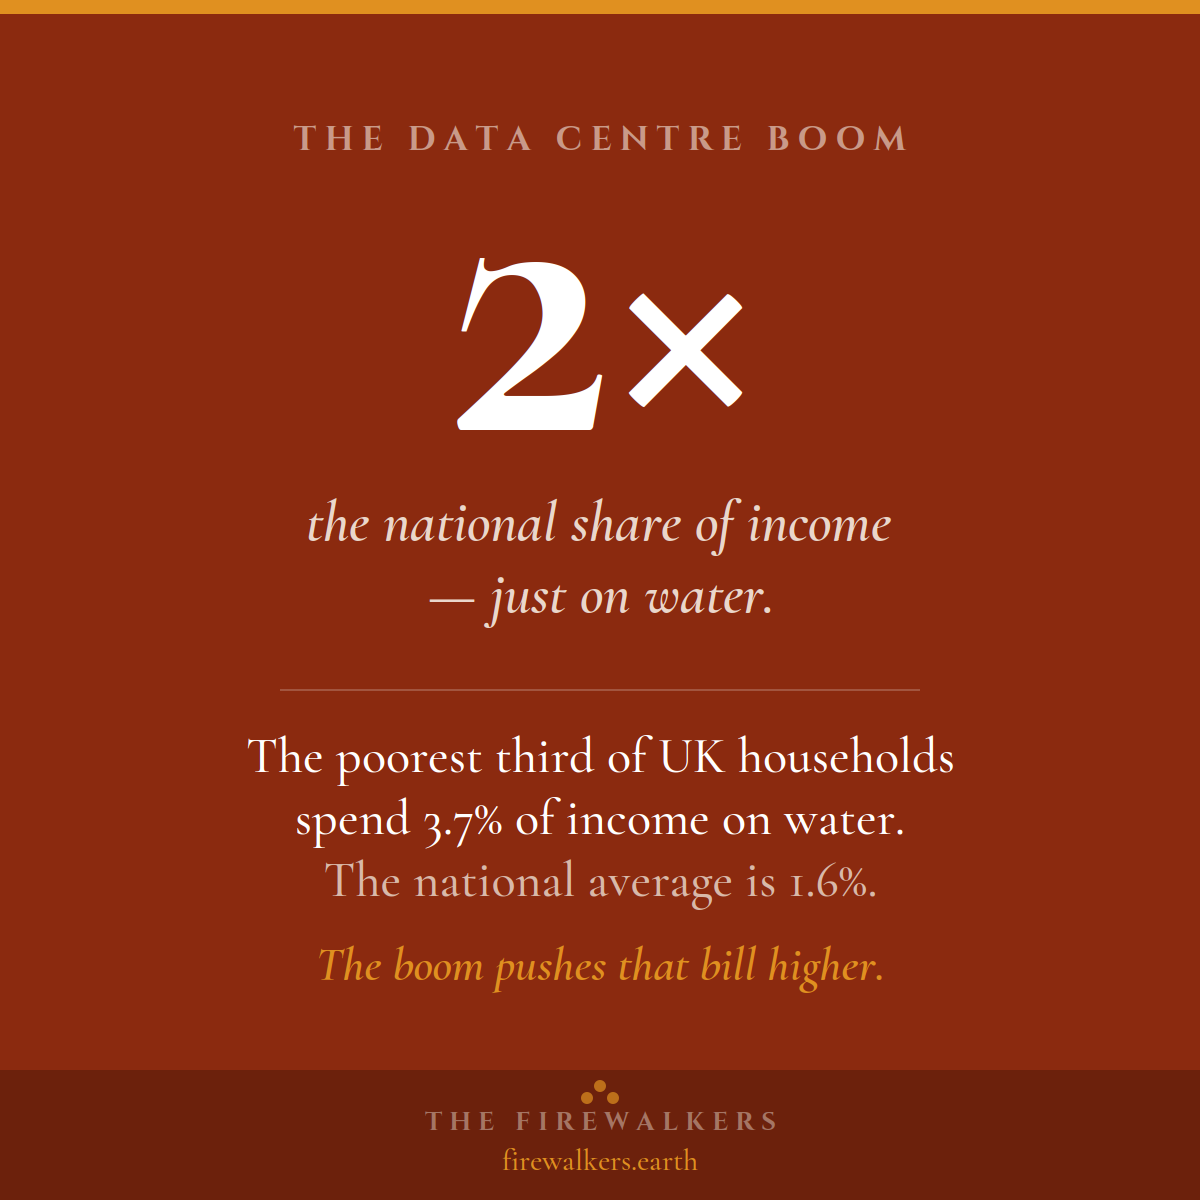
2× — the poorest pay twice the national share on water
3.7% of income versus a 1.6% average. The boom pushes that bill higher — onto the people least able to carry it.
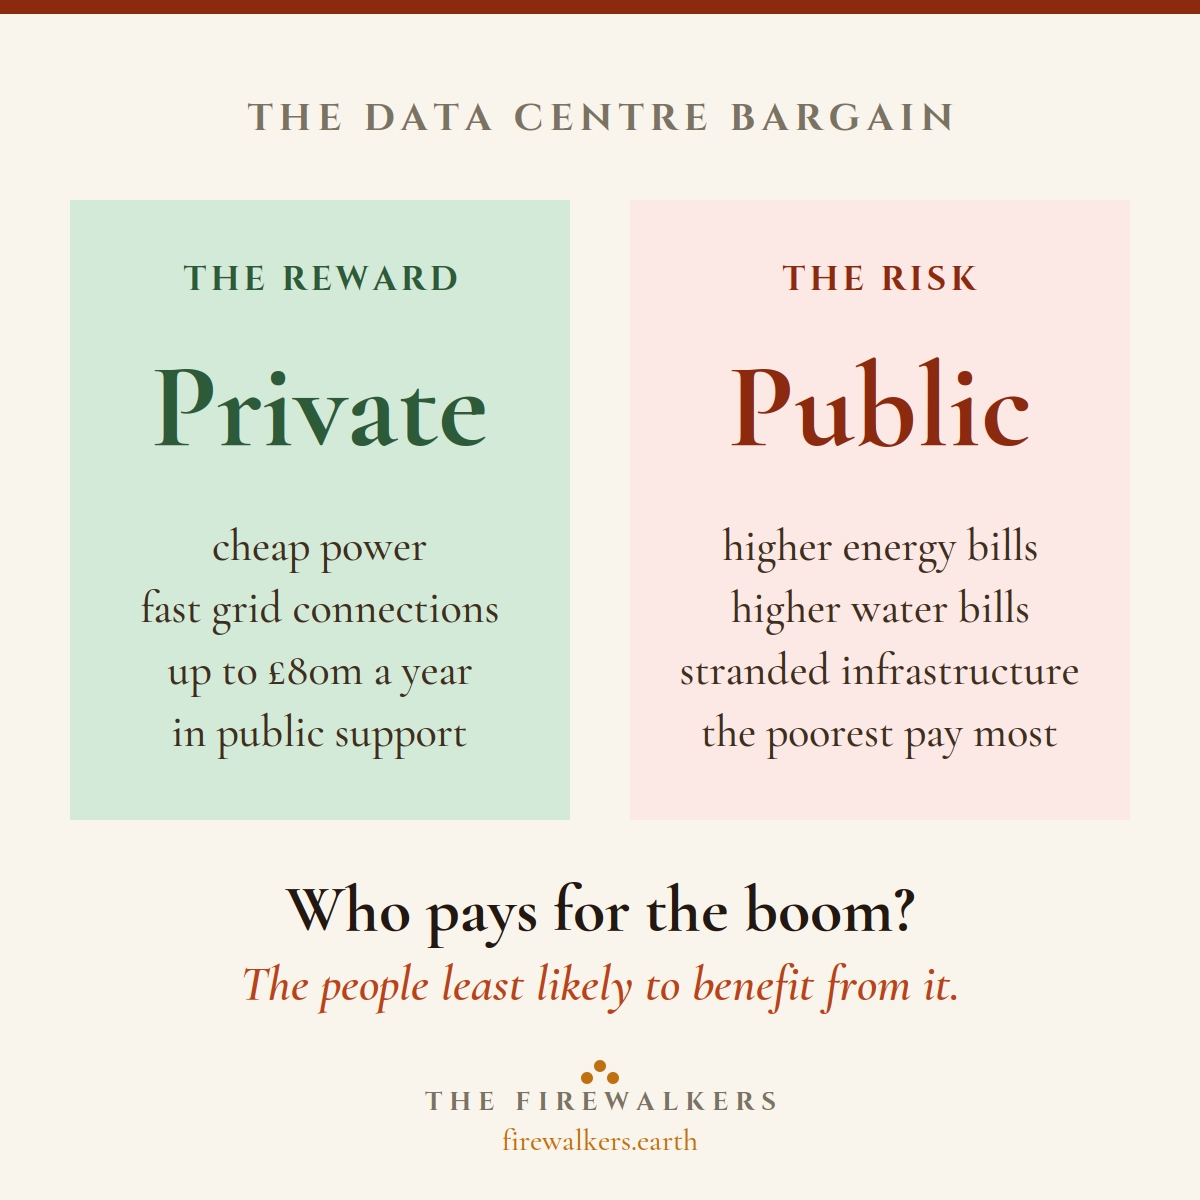
Private reward, public risk
Operators get cheap power and £80m a year in support. Billpayers carry the risk. The clearest framing of the whole debate.
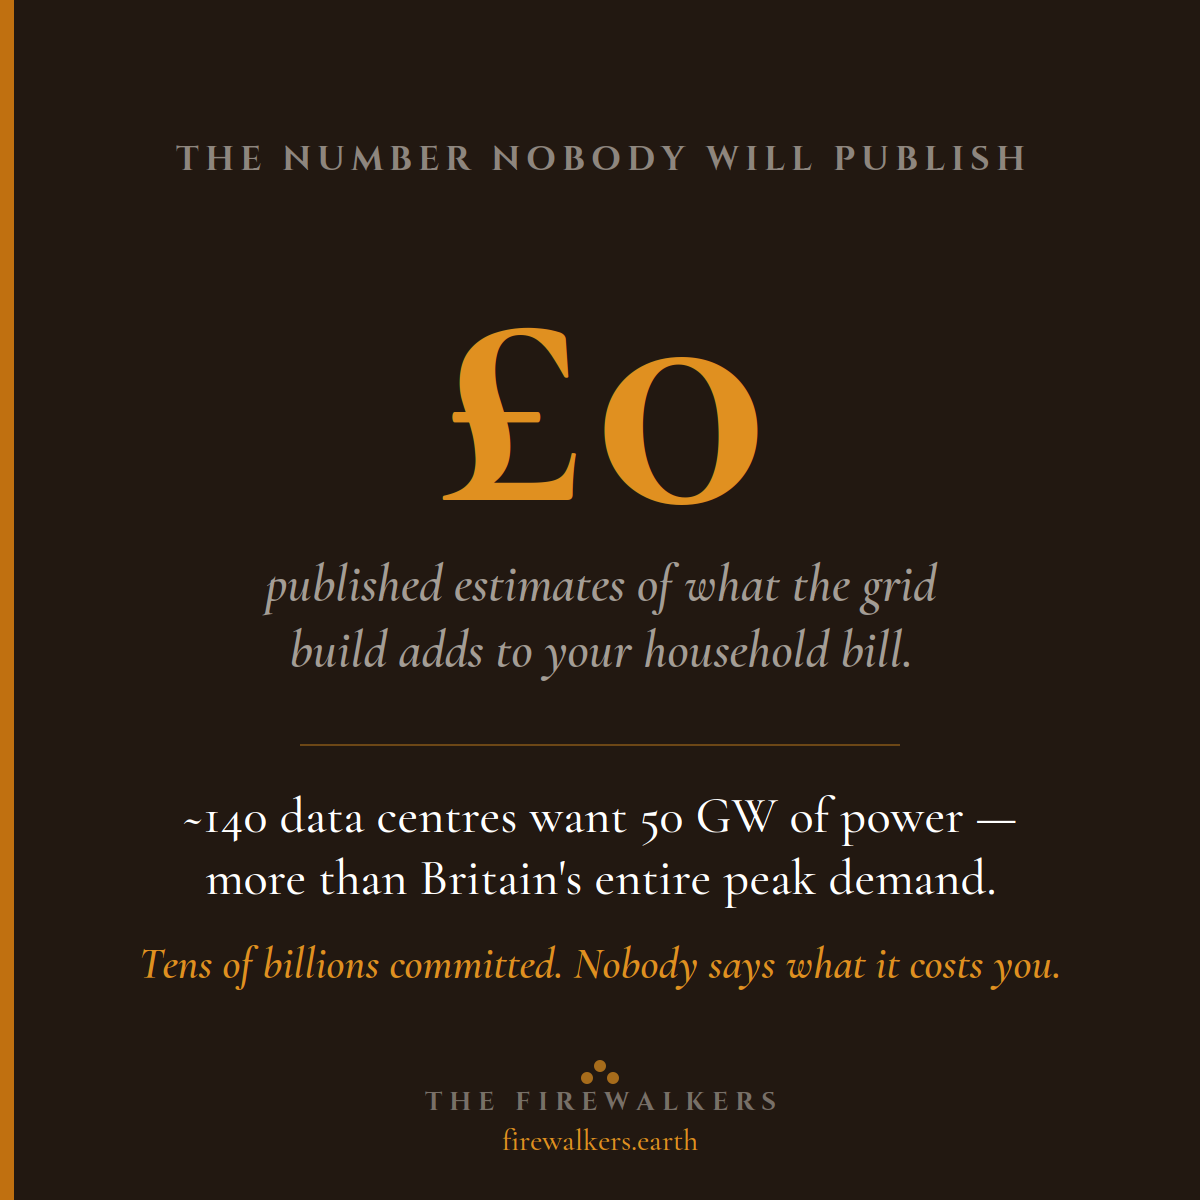
£0 — the household-cost estimate nobody will publish
~140 data centres want 50 GW — more than Britain's entire peak. Tens of billions committed, and nobody says what it costs you.
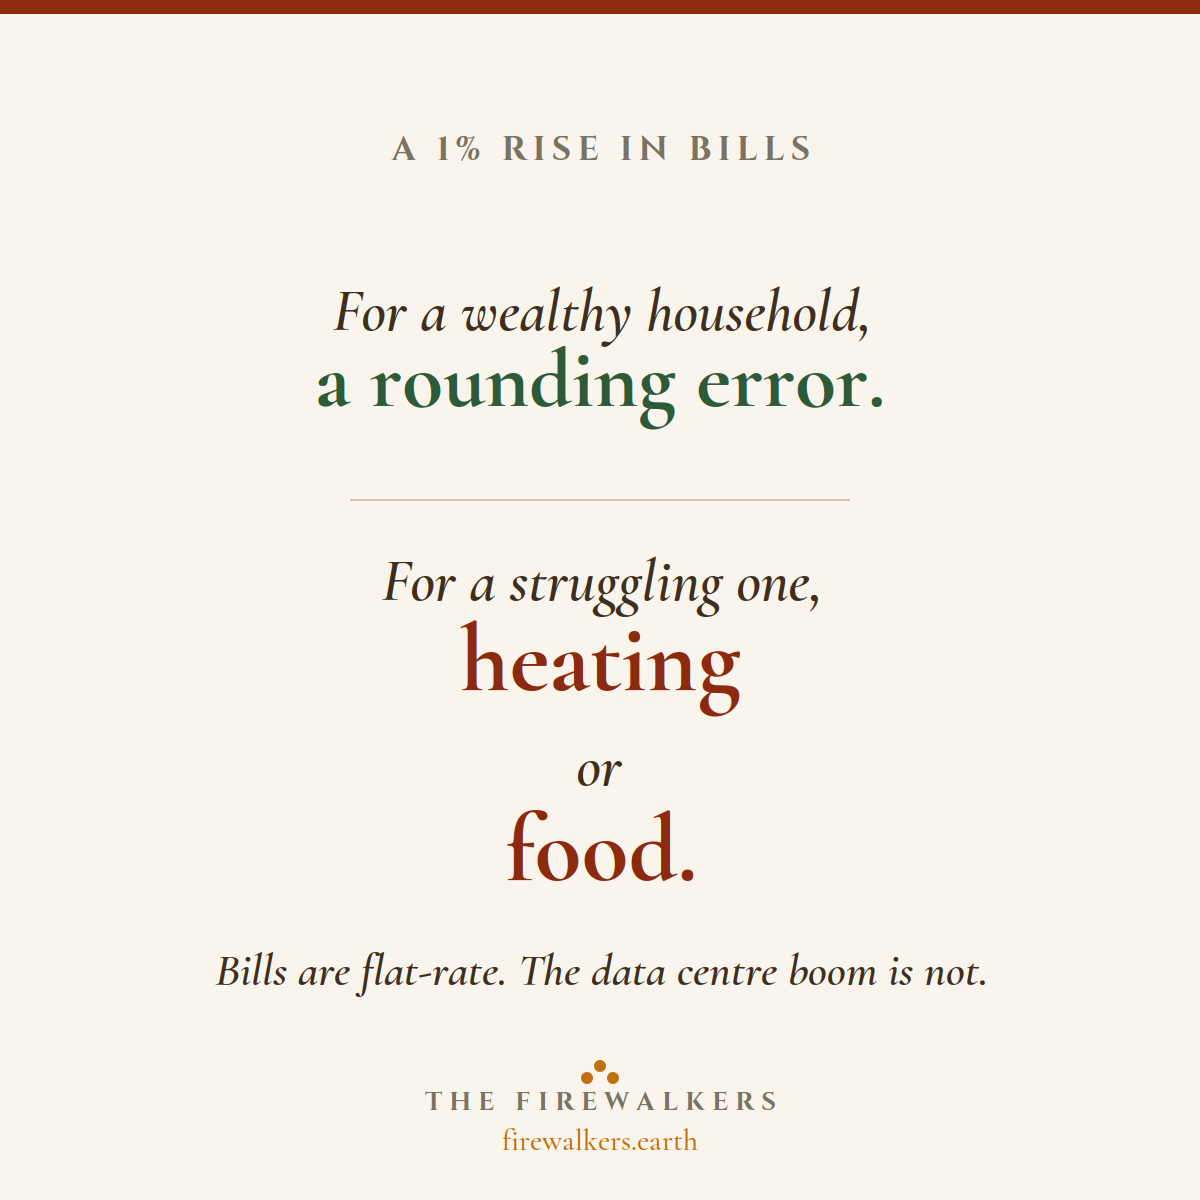
A 1% rise: a rounding error, or heating versus food
Bills are flat-rate. The same increase is nothing to a wealthy household and an impossible choice for a struggling one.
Who decides when a data centre is fast-tracked?
Published June 2026 · Sourced from UK Government, NSIP regime, JLARC Virginia · Read the full research → · 60-second TL;DR →
National, not local — who decides on the biggest sites
Routed through the Nationally Significant Infrastructure regime, the largest data centres are decided by central government — not your council.

Speed vs. consent
The same mechanisms that remove barriers to investment also remove the channels for a community to be heard. Right now, the framework favours speed.
Benefits vs. costs — be honest about both
Benefits are real but their long-term local delivery is unproven. The resource costs are concentrated and certain. Both belong in the decision.

Make the safeguards binding
Confirmed water supply and social-value assessment as enforceable conditions, not descriptions. Independent oversight. Sunset clauses on accelerated powers.
Want a fact turned into a card?
If you have a stat, a quote, or a claim from our research that you want as a shareable graphic — tell us. The best suggestions become the next pack.